Reports & analytics
Every module has its own reports; this module gathers them and adds institution-wide analytics on top. Each area is a separate permission, so the catalogue you see is the catalogue you are entitled to.
What it is for
Institution-wide reporting and analysis.
Who can do it
VCDVC-Admin & FinanceDVC-Academic AffairsRegistrarCampus Directorany role with an analytics permission
Needed first
- Data in the modules being reported on
- The analytics permission for that area
Where it ends
Figures you can defend, with the filters that produced them stated.
The catalogue and the ten areas
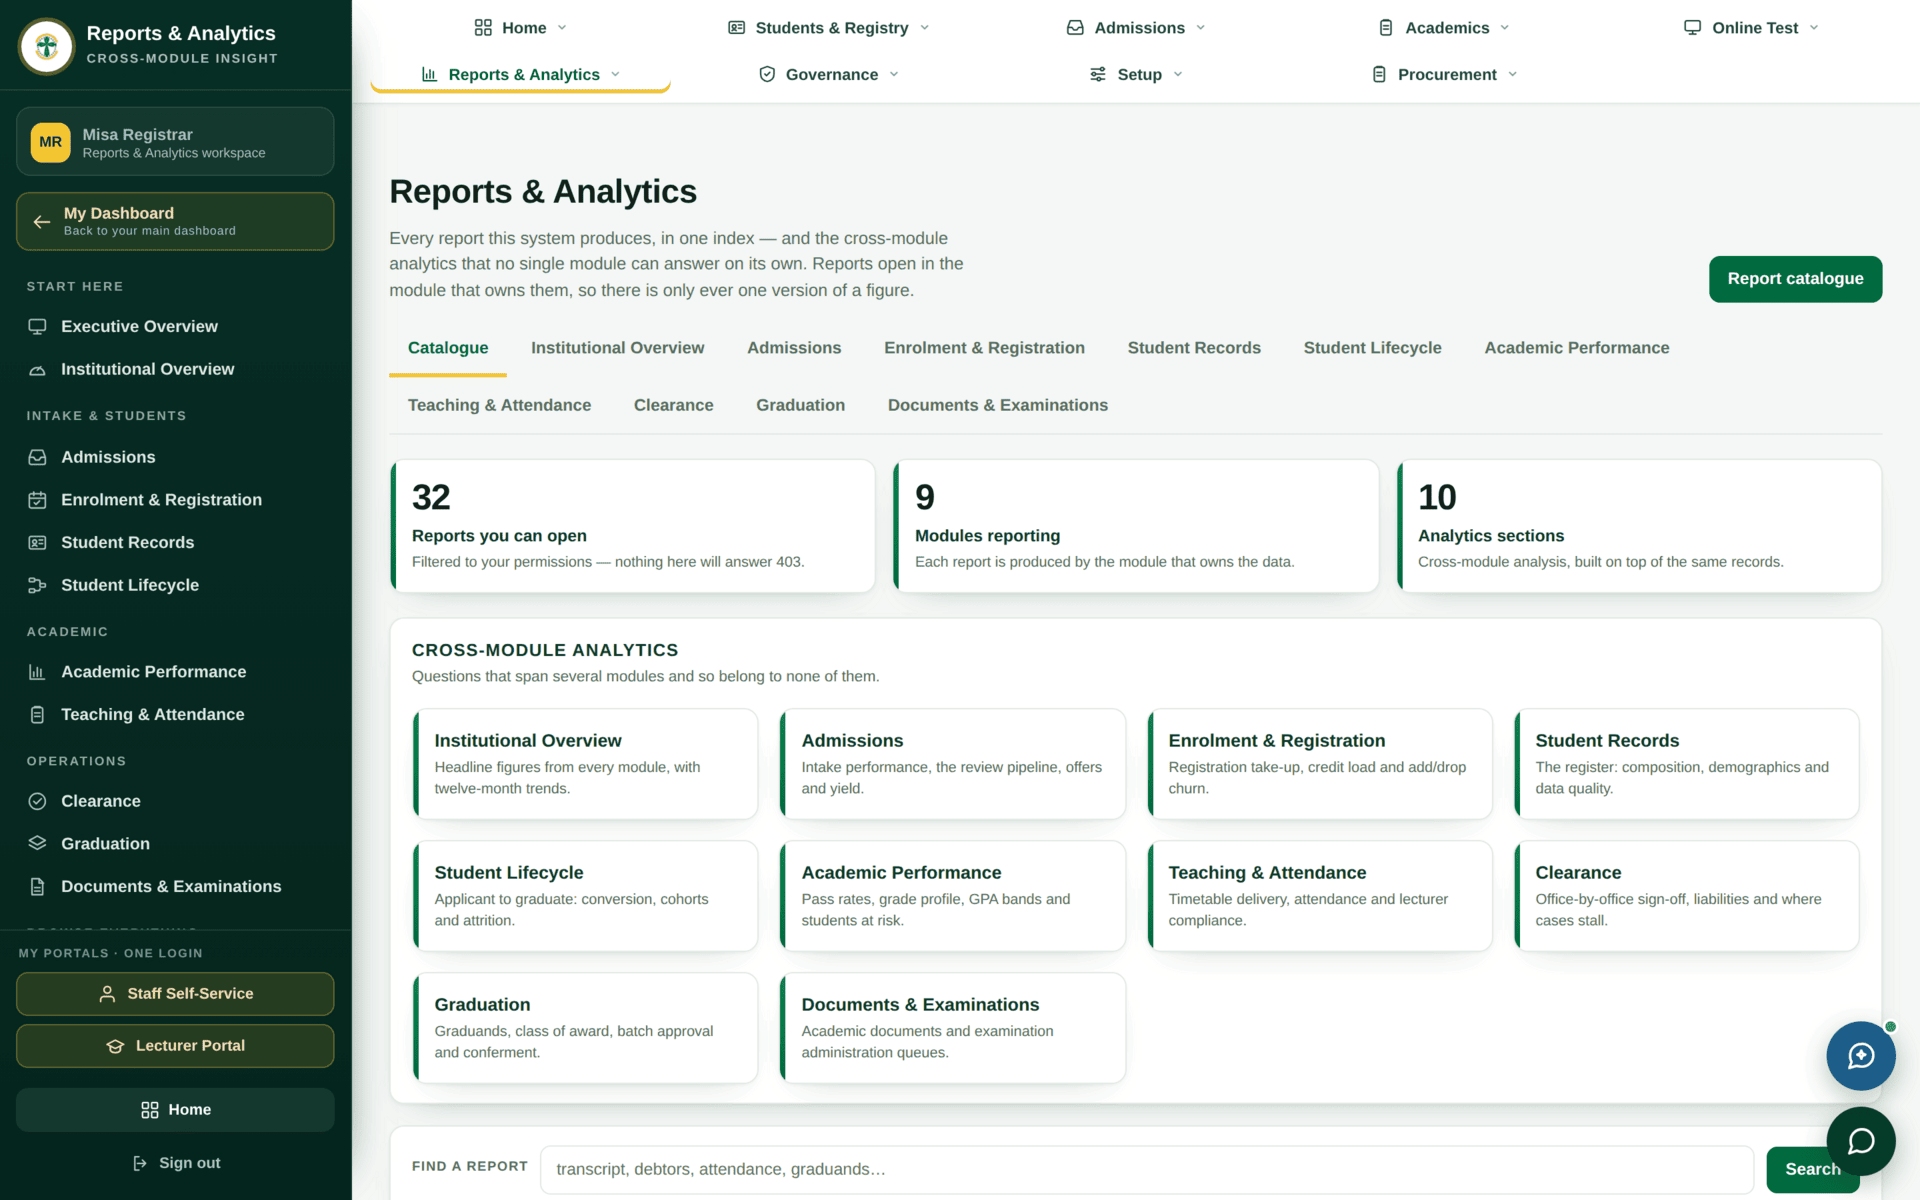
| Area | Permission | Answers |
|---|---|---|
| Institutional Overview | analytics.overview.view | The whole institution on one page |
| Admissions | analytics.admissions.view | Applications, conversion, intake |
| Enrolment & Registration | analytics.enrolment.view | Who registered, and who did not |
| Student Records | analytics.students.view | The register by any dimension |
| Student Lifecycle | analytics.lifecycle.view | Progression, deferment, withdrawal, completion |
| Academic Performance | analytics.academic.view | Marks, grades, pass rates |
| Teaching & Attendance | analytics.teaching.view | Load and attendance |
| Finance | analytics.finance.view | Billing, collection, debt |
| Clearance | analytics.clearance.view | Where cases are stuck, by office |
| Graduation | analytics.graduation.view | Graduands, classifications, trends |
| Documents & Examinations | analytics.services.view | Service delivery |
| System Usage | analytics.system.view | Who is using what |
The Executive Overview
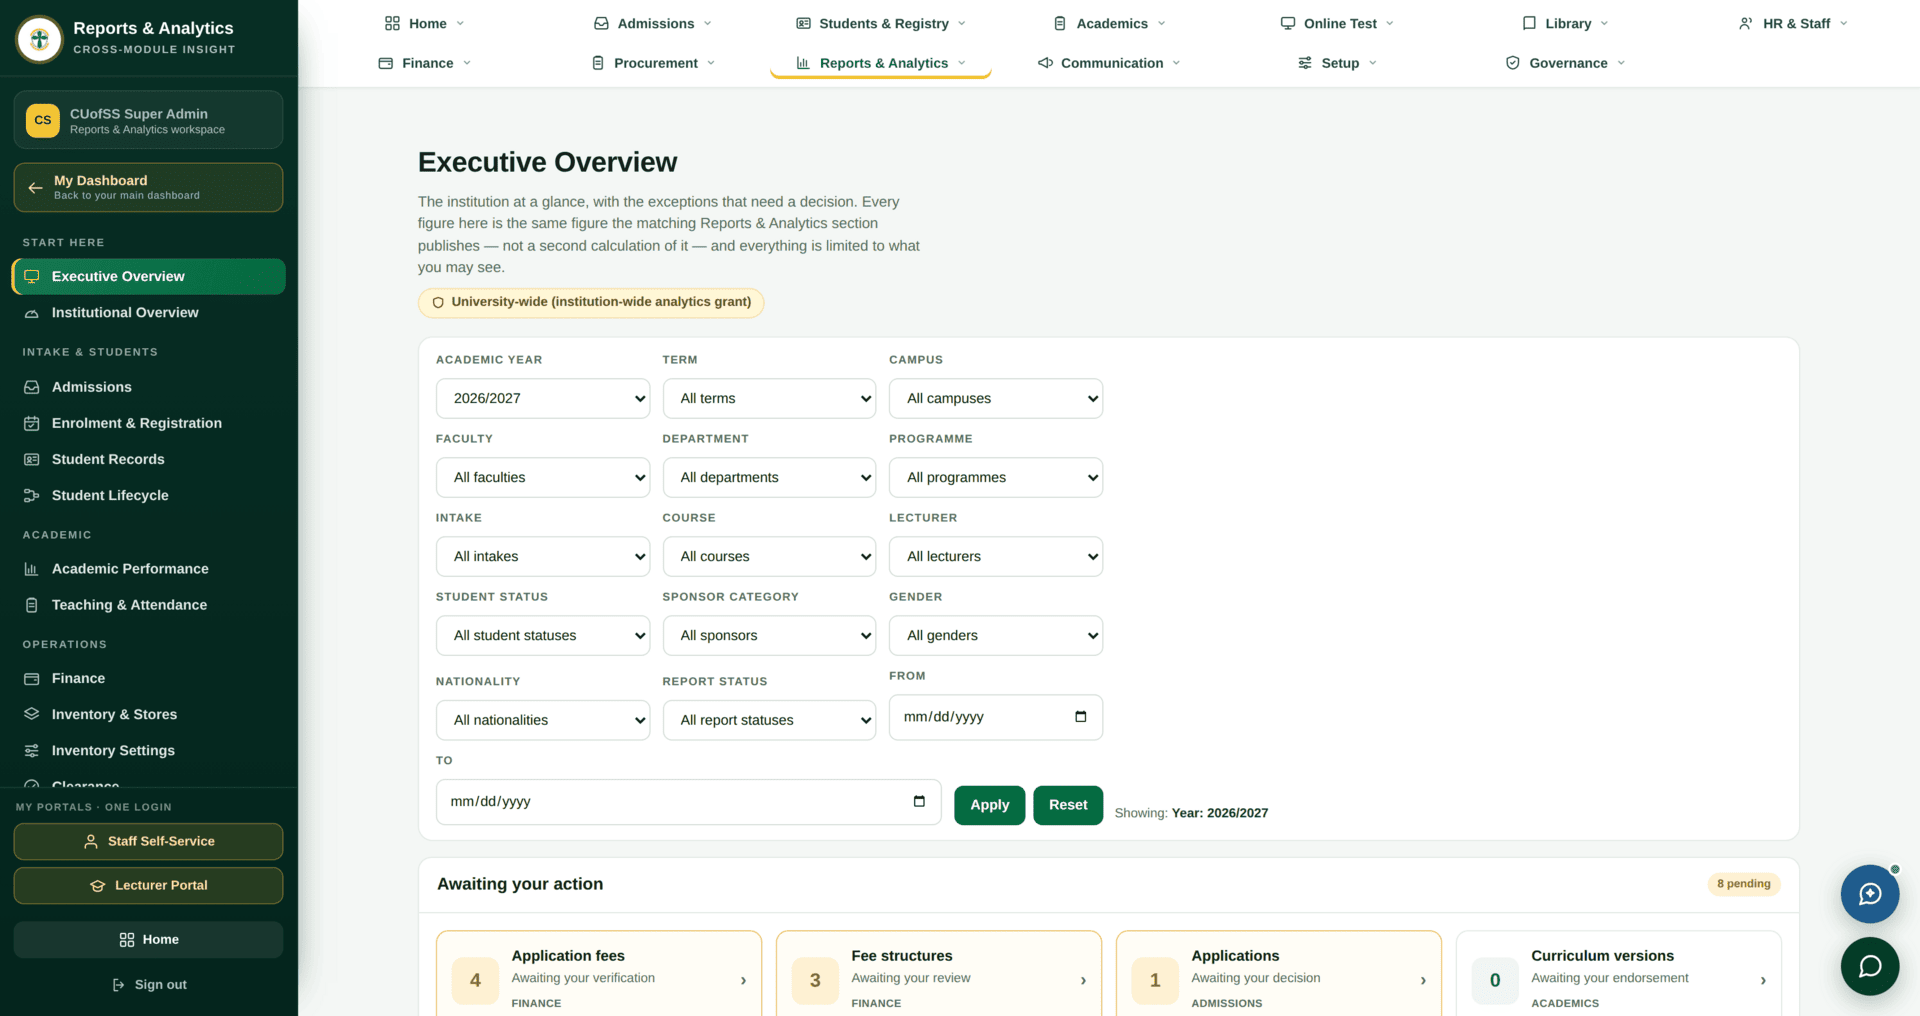
executive.dashboard.view. Intake, enrolment, money and workforce on one
page.
It is wide
The executive overview is laid out for a large screen and will run wider than a laptop window. Scroll it sideways rather than assuming panels are missing, and use a full-width window when presenting from it.
Making a figure mean something
Three ways to produce a wrong number confidently
- The default term. Several screens open on the latest academic term, which is often a future one with no data. Every count then reads zero. Set the term before you read anything — the Examination Dashboard is the worst offender.
- Exporting before filtering. An export contains exactly what the filters produced, not the whole table. Filter first, check the row count on screen, then export.
- Comparing scoped figures. A Dean's number and the Registrar's number for the same thing will differ, and both are right — one is a faculty, one is the institution. State the scope alongside the figure.
Worked example
Producing an enrolment figure for a Board paper
| 1. Define it | “Registered” or “on the register”? They are different numbers — see Student records |
| 2. Set the period | Academic year and term, explicitly. Never accept the default |
| 3. Set the scope | All campuses, or one. Write it down; it goes in the caption |
| 4. Read on screen | Note the row count before exporting |
| 5. Export | Excel or CSV. Check the row count matches |
| 6. Cross-check | Against a second source — the SIS band, or Semester registration tiles. Two sources agreeing is what makes a figure defensible |
| 7. Caption it | “Registered students, 2026/2027 Sep-Dec, all campuses, as at 29 Aug 2026.” A number without those four facts is not a figure, it is a rumour |
If a report will not open
| Symptom | Cause | Fix |
|---|---|---|
| An area is missing from the catalogue | You do not hold that area's permission | Request it by name from the table above |
| Everything reads zero | The period filter defaulted to an empty future term | Set the term and apply |
| Your figure differs from a colleague's | Different scope or different period | Compare the filters before comparing the numbers |
| The export has fewer rows than the screen | Pagination is not the filter — but the filter is | Clear filters, apply, export |
| A dashboard runs off the screen | Wide layout | Scroll sideways; maximise the window |